
| Day | Date | Time | Title |
|---|---|---|---|
| 1 | 2026-02-05 | 09:30 - 10:00 | Welcome and Introduction to Research Data Management |
| 1 | 2026-02-05 | 10:00 - 11:00 | Project & Data Organization |
| 1 | 2026-02-05 | 11:00 - 12:00 | Data Management Plans (DMPs) |
| 1 | 2026-02-05 | 12:00 - 13:00 | Lunch Break |
| 1 | 2026-02-05 | 13:00 - 14:00 | Command Line |
| 1 | 2026-02-05 | 14:00 - 15:00 | Best practices for rectangular data |
| 1 | 2026-02-05 | 15:00 - 16:30 | Brain Imaging Data Structure (BIDS) |
Best practices for rectangular data
Research Data Management for Psychology and Neuroscience
Course at University of Hamburg, RTG 2753: Emotional Learning and Memory
Slides | Source
![]()
14:00
Schedule
This session: Best practices for rectangular data
Objectives
💡 You can apply the 12 rules of rectangular data to organize research datasets effectively.
💡 You understand the principles of tidy data and can identify when data meets tidy data criteria.
💡 You can convert between wide and long data formats.
💡 You can implement data validation techniques to detect and prevent common data entry errors.
💡 You can apply best practices for file naming and data organization in research projects.
💡 You can identify and fix data problems such as empty cells, inconsistent formatting, and mixed data types.
💡 You understand the importance of data dictionaries and can create them for your datasets.
1 Rules of rectangular data
Rectangular data
If you do not have a community standard specifying the data organization (and you have tabular data), we highly recommend using the rules of rectangular data as proposed by Broman & Woo (2018).
Rules of rectangular data (according to Broman & Woo, 2018)
Mini exercises: What are the rules?
- Be consistent.
- Choose good names for things (see “Project & Data Organization”).
- Write dates in the format
YYYY-MM-DD(see “Project & Data Organization”). - Do not leave empty cells.
- Put just one thing in a cell.
- Make it a rectangle.
- Create a data dictionary.
- Do not perform calculations in the raw data files.
- Do not use font color or highlighting as data.
- Make backups.
- Use data validation to avoid errors.
- Save the data in plain text files.
Be consistent
It sounds easier than it is. But if you organize your data consistently from the start, you will not have to spend additional time later “harmonizing” the data.
Use consistent codes for:
- Categorical variables (decide between
male,Male,m,M) - Missing values (prefer
NAor similar, avoid e.g.,-999) - Variable names (decide between
saliva_10wk,Saliva_10wk,sal_week10) - Subject identifiers (decide between
003,pcp003,person-003)
Additional consistency rules:
- Data layout across multiple files
- File names (decide between
TSST_VR_2024-11-19.csv,2024-11-19_TSST_virtual-reality.csv) - Date format for all dates
- Extra spaces within cells (“male” vs ” male “)
No empty cells
❌ Don’t do this:
✅ Do this instead:
Do fill out every cell. When information is missing, use a common code to indicate that it is missing (preferably NA).
One thing per cell
❌ Don’t do this:
✅ Do this instead:
- In one piece of a spreadsheet, which is a cell, there should only be one piece of information.
- Do not include units in your cells. It is better to put units in a data dictionary.
- The same applies to notes. Instead of writing
0 (below threshold), create a new column callednoteand write0in the first column andbelow thresholdin the second.
Make it a rectangle
- Use columns for variables and rows for subjects or observations
- The first row should contain variable names
- If some data do not fit into one dataset, create a set of rectangular datasets and save them in separate files
- Do not use multiple header rows
Example of multiple header rows
| A | B | C | D | E |
|---|---|---|---|---|
| day_1 | day_2 | |||
| ID | sleep | sport | sleep | sport |
| 34 | 7.5 | 3 | 6 | 0.5 |
| 35 | 8 | 0 | 8.5 | 0.5 |
| 36 | 6 | 2.5 | 7.5 | 3 |
Note: This table deviates from the rectangle form. It also leaves multiple cells empty.
More rules
No calculations in raw data
- Primary data should just be data. Only data.
- There should be no means and standard deviations calculated in that primary data.
- Use scripts to calculate whatever you want, but do not make changes in the primary dataset.
No font color or highlighting as data
- If you identify outliers or other information you want to highlight, do not highlight them using visualization.
- Instead, create a new column called
outlierand mark the identified outliers asTRUEand the others asFALSE. - Visualization is useful in the short term, but it makes it difficult to extract this information for later analysis.
Make backups
Back up your data regularly in multiple locations.
- Consider using a version control system like Git
- When you have finished entering data, write-protect your data file
- This ensures that you do not accidentally make changes to your dataset
Save data in plain text files
- Save your data files in e.g.,
.csvformat (“comma-separated values”) - Maximum compatibility
- Reproducibility across platforms
- Future-proof
- In countries where commas are used as decimal separators, tab-delimited text files (
.tsv) might be an appropriate alternative to.csv
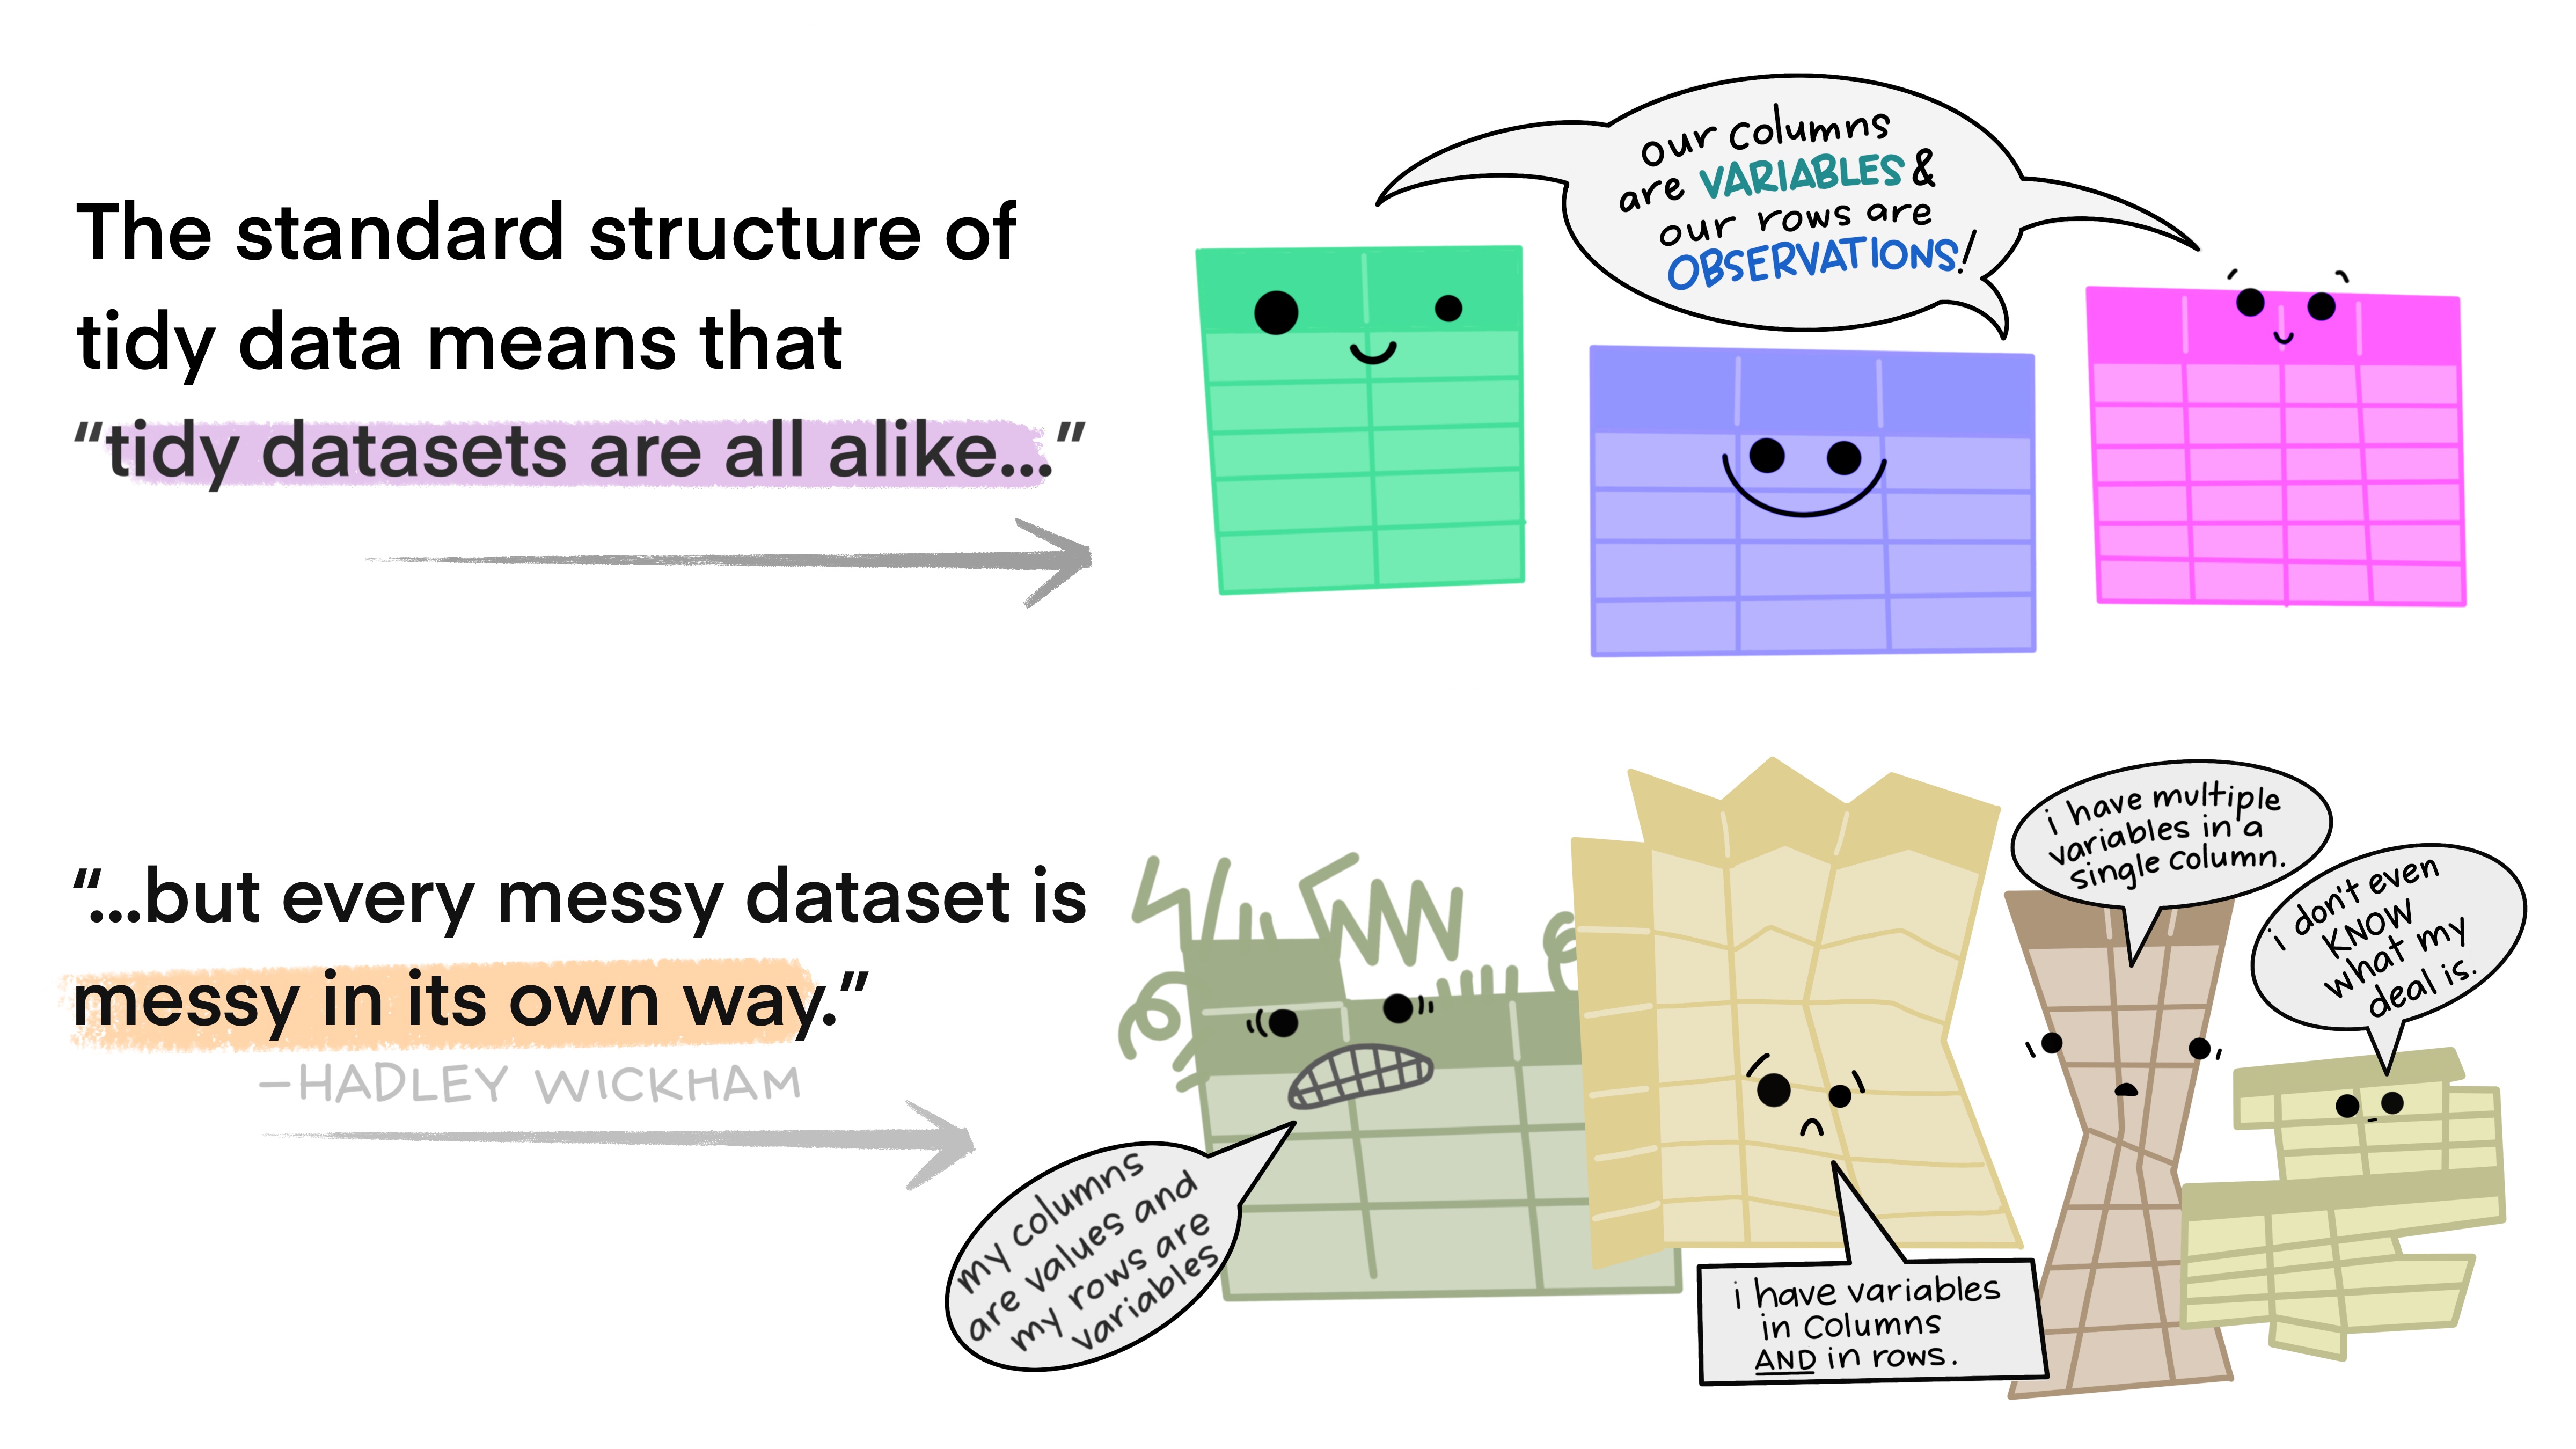
2 Tidy data
What is tidy data?
Tidy data rules
- Each variable is a column, and each column is a variable.
- Each observation is a row, and each row is an observation.
- Each value is a cell, and each cell contains a value.
Data structures: wide vs long format
Data can be structured in different ways. When your data is tidy, you may still encounter wide or long formats.
Wide format
- Each participant is one row
- Variables spread across columns
- Good for summary tables
Long format
- Each observation is one row
- Variables stacked vertically
- Good for analysis
Transforming data
Validate your data
Ensure that your entered data is error-free by applying data validation techniques. Use packages like assertr in (Fischetti, 2023) to validate your data:
❌ Invalid data (demonstrates failure)
verification [reaction_time > 200] failed! (1 failure)

    verb redux_fn           predicate column index value
1 verify       NA reaction_time > 200     NA     7    NA

Error : assertr stopped execution
3 Data dictionaries
What is a data dictionary?
- In addition to rectangular data, it is also valuable to have a data dictionary describing how your data is structured.
- The data dictionary is also sometimes referred to as a codebook.
What should a data dictionary contain?
According to Broman & Woo (2018), your dictionary should contain:
- The exact variable name as in your data file
- A version of the variable name that might be used in data visualizations
- A longer explanation of what the variable means
- The measurement units
- Expected minimum and maximum values
Additional information for survey data
When analyzing data collected from a survey, a variable in your dataset will likely represent an item from that survey:
- The item in the survey
- The original wording of the item
- The subscale the item belongs to
- The author responsible for that item/subscale
- The response format for the item
- Special considerations regarding the item
Data dictionary format
- A recommended option for a data directory structure is to use a
.jsonfile. jsonstands for JavaScript Object Notation.
Benefits of JSON files
Providing metadata in a json format has some useful advantages:
- It is easy for humans and especially machines to read
- You can read in the json file into and use the data information for your data analyses
- In comparison to spreadsheets,
jsonfiles are not limited to two-dimensional in- and outputs
4 Exercises
Exercise 1
Exercise 1: Identifying rectangular data rules
- Look at the following dataset examples and identify which rules of rectangular data are being violated.
- For each violation, explain how you would fix it.
Dataset A
Dataset B
Exercise 2
Exercise 2: Wide vs. long data conversion
Given the following wide-format dataset about students’ test scores:
- Explain what this dataset would look like in long format. What are the names of the columns?
- Convert this dataset to long format using
pivot_longer()in . - Convert it back to wide format using
pivot_wider()in . - Explain when you would prefer wide format vs. long format for this type of data.
Exercise 3
Exercise 3: Data validation with assertr in
You have collected reaction time data from a psychological experiment. Write validation rules using the assertr package in to check for the following conditions:
In in , write verify() statements to check that:
- All reaction times are between 200 and 2000 milliseconds
- All accuracy values are between 0 and 1
- All participant IDs start with “P”
- The condition column only contains “control” or “treatment”
Test your validation rules with the sample dataset. What errors do you find?
Exercise 4
Exercise 4: Tidy data principles
Examine the following dataset and determine whether it follows tidy data principles:
- Is this dataset tidy? If not, what principles are violated?
- Reorganize this dataset to make it tidy. You may need to create multiple datasets if necessary.
- Explain your reasoning for the restructuring you chose.
Exercise 5
Exercise 5: Data organization best practices
You are starting a new research project studying the effects of different teaching methods on student performance. You plan to collect data from 3 schools, with 2 different teaching methods, over 4 time points, measuring math and reading scores.
Design the structure for your main dataset following rectangular data principles. Include:
- Appropriate variable names
- A clear layout (wide or long format - justify your choice)
- How you would handle missing data
- What data validation rules you would implement
Create a small example dataset (5-6 rows) that demonstrates your design.
Write a brief data dictionary for your variables.
Exercise 6
Exercise 6: File naming and organization
You have the following research files that need to be renamed according to best practices:
final_results.xlsx
data backup.csv
Results-UPDATED-2024.csv
Math scores (corrected).xlsx
science_scores_final_FINAL.csv
reading data - Jan 15.txt- Propose new file names that follow consistent naming conventions.
- Explain the naming convention you chose and why.
- How would you organize these files in a folder structure?
Exercise 7
Exercise 7: Fixing common data problems
The following dataset contains several common data entry errors. Identify and fix them:
- List all the problems you can identify in this dataset.
- Clean the dataset by fixing these issues.
- Write validation rules that would catch these types of errors in the future.
Resources
- dplyr documentation
- tidyr documentation
- assertr package vignette
- Broman & Woo (2018) “Data Organization in Spreadsheets”
References
Broman, K. W., & Woo, K. H. (2018). Data organization in spreadsheets. The American Statistician, 72(1), 2–10. https://doi.org/10.1080/00031305.2017.1375989.
Fischetti, T. (2023). Assertr: Assertive programming for r analysis pipelines. https://doi.org/10.32614/CRAN.package.assertr. R package version 3.0.1https://docs.ropensci.org/assertr/ (website) https://github.com/ropensci/assertr.
RDM Course