In this chapter you will learn the basics of research data management.
Learning Objectives
💡 You can argue why research data management is important. 💡 You know constraints to reproducibility when research data management lacks sufficiency. 💡 You know about practical measures and community standards for better research data management.
5.1 Introduction
Video 5.1: “Data Sharing and Management Snafu in 3 Short Acts”. The video by Hanson, Surkis, and Yacobucci (2019) from NYU Health Sciences Library features a cute animated panda researcher making a data sharing request to a bear researcher. It does not go well. The video aims to communicate some of the common and avoidable pitfalls of research data management in a light-hearted format. Topics include storage, documentation, and file formats. The video was produced using a tool called Xtranormal (now “nawmal”) and the characters are strangely expressive while talking in robotic text-to-speech voices with a limited range of movement. It was created and uploaded to YouTube by librarians at NYU School of Medicine in 2012 to be used for research data management education and has been included in numerous research data management courses and presentations. License: Creative Commons Attribution 4.0 International (CC BY 4.0). Reused without modifications.
In 2010, the US economists Reinhart and Rogoff presented a research paper called Growth in a Time of Debt at the annual meeting of the American Economic Association. They found that economic growth slows dramatically when a country’s debt size rises above 90% of Gross Domestic Product (Reinhart and Rogoff 2010). EU Commissioner Olli Rehn and US Republican Paul Ryan both quoted a 90% debt-to-GDP limit to support political austerity strategies.
Meanwhile, a student at the University of Massachusetts, Thomas Herndon, received a class assignment to reproduce the results of a research article. Herndon chose the article by Reinhart and Rogoff (2010) and failed to reproduce their results repeatedly, even after supervision with his professor.
Subsequently, Herndon requested the spreadsheet from the authors of Reinhart and Rogoff (2010). He then realized that the paper contained selective data selection, odd data averaging methods, and coding errors that led to substantial miscalculations (Herndon, Ash, and Pollin 2014).
Herndon, Ash, and Pollin (2014) concluded that the results of Reinhart and Rogoff (2010) are much less dramatic than originally assumed. However, the basic tendency that economic growth slows down with higher debt still held true.
What matters most about this story is that Reinhart and Rogoff were able to share their original spreadsheet and that the results were then reproducible. Thus, reproducibility can enhance the scientific, and in this example the political, discussion about research findings and their implications for society.
Tip 5.1: Excel exercise
Open an Excel Sheet
Set the first column to date-format
Enter the year 2010 into the cell A1
Isn’t it spectacular that Excel rendered your entry as 2nd July 1905?
Think about this phenomenon in your research context: What problems might arise when using Excel?
NoteMore problems when using Excel …
As the exercise above showed, Excel can automatically convert specific data entries. In many everyday cases, this seems to be useful, for example for autocompletion of dates. However, in a research context, such conversions hinder reproducibility efforts. Thus, we highly recommend using and RStudio to read and analyze data.
The described phenomenon of Excel conversions is highly prevalent in the scientific research area of biogenetics. A meta-analysis found that roughly 20% of published genetic research was affected by Excel errors (Ziemann, Eren, and El-Osta 2016). Instead of changing Excel’s default options, this situation led to a change in scientific standards. The HUGO Gene Nomenclature Committee (HGNC) updated their guidelines on how to name genes. It was easier to rename genes than to update Excel!
Given the information above, you might wonder why many researchers still use Excel. One aspect at least is that is very intuitive to use. It comes with many integrated functions that can be easily applied to data. Compared to it takes much less time to work with data in Excel. However, the most important aspect might be that it is incredibly easy to enter data in a spreadsheet. It takes much less time in Excel compared to R, to open a table and add data to it. Thus, for data entry, Excel is still a good choice (apart from the problems in Tip 5.1). Nevertheless, all computations should be done in R or a different software program where data changes and computations are saved in scripts (e.g. Python), because the computations in Excel are hard to reproduce.
As the introductory sections highlighted, research data management (also referred to as RDM) is very important for increasing the reproducibility of your research. We follow the definition of The Turing Way for RDM:
RDM covers how research data can be stored, described and reused (The Turing Way Community 2022, chapter on Research Data Management).
5.2 Benefits of research data management
Managing data well throughout the research process is crucial for successful research outcomes, including:
Upholding research integrity and reproducibility
Improving research productivity
Ensuring the accuracy, completeness, authenticity, and reliability of research data and records
Saving time and resources in the future
Strengthening data security and reducing the likelihood of data loss
Avoiding redundant work by facilitating data sharing
Meeting the grant requirements of funding bodies
Adhering to industry and commerce practices.
5.3 Modularity of research data
In the previous sections of this chapter, you have seen pitfalls for reproducibility when not thinking about RDM. Further, you now know advantages of RDM. In this section, you will get to know the concept of modularity, that has been widely used in research that is meant to be reproducible.
In software design, modularity refers to a logical partitioning of the “software design” that allows complex software to be manageable for the purpose of implementation and maintenance (Wikipedia Contributors 2025).
Tip
Even though this section deals with modularity of data, the concept of modularity can also be applied to code.
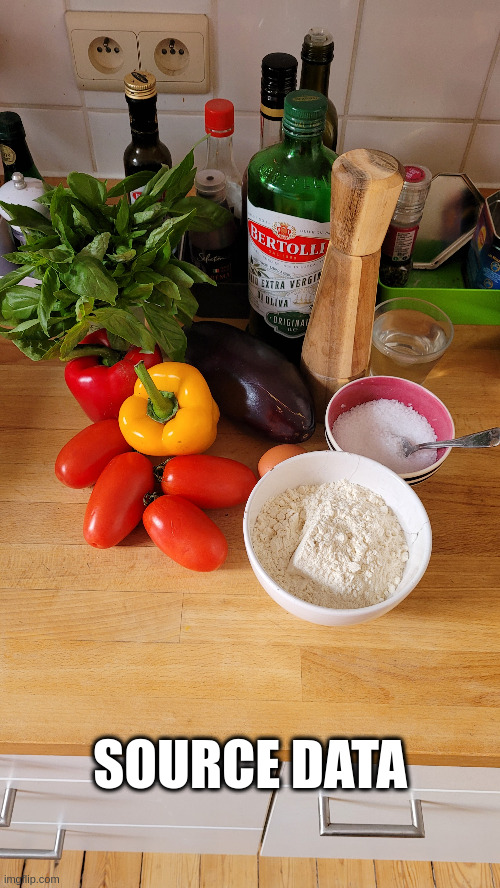
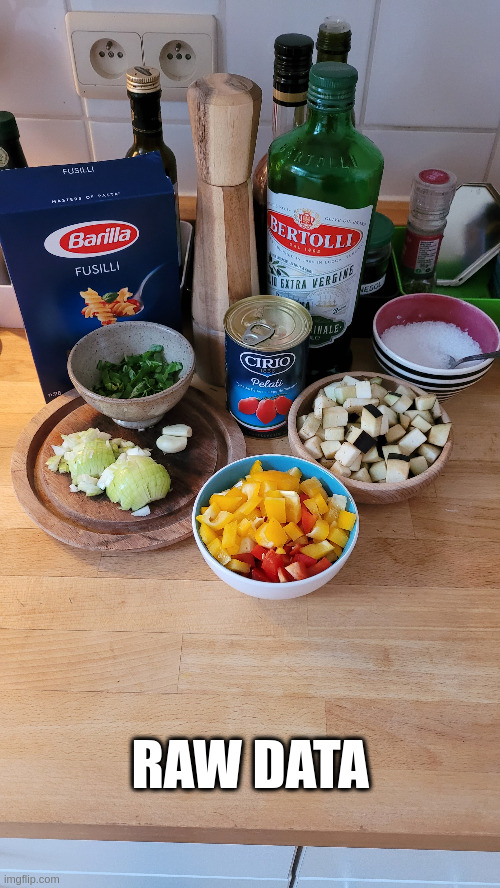
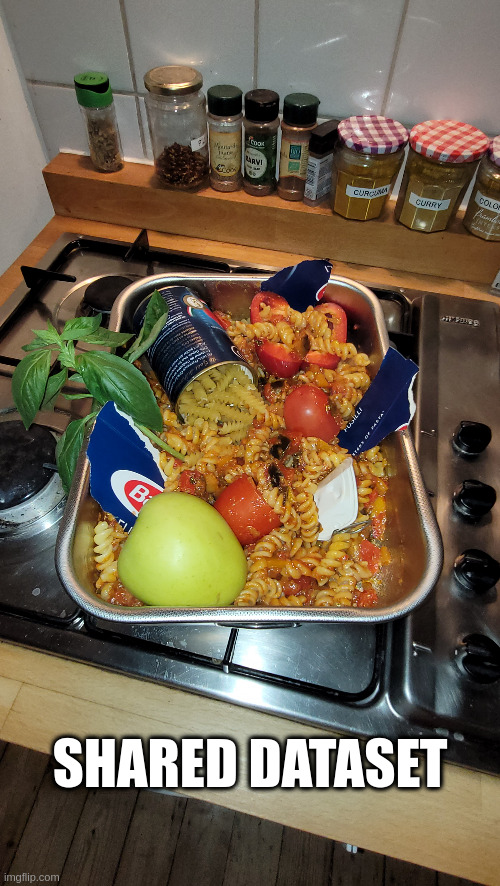
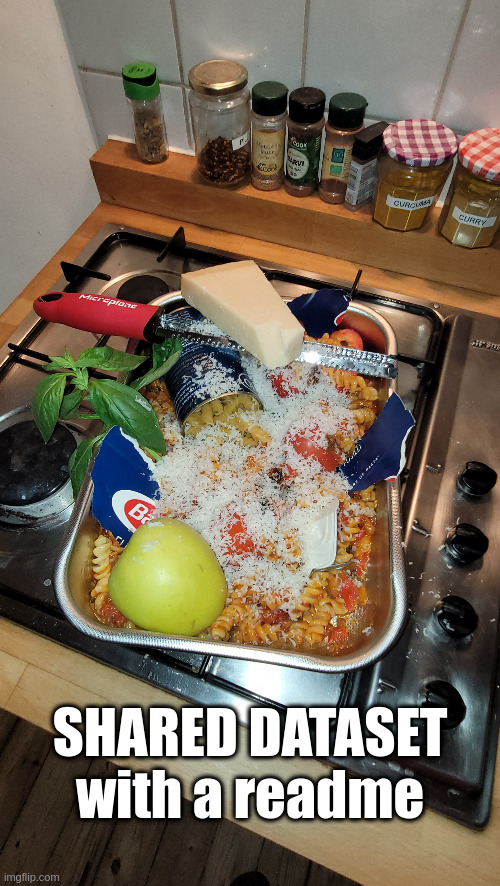
The photo series displayed above shows how expectation and reality differ in terms of how well data is prepared. Reading a methods section of a published paper suggests a clear, tidy, and logic structure of the data and the respective analyses. When diving into the actual datasets, many things seem messy. Then, also a README will not help. Thus, it makes sense to have research data management from the beginning on in mind.
TipQuestions helping to manage research data
How should my data look like before data analyses?
Which analyses do I want to conduct? Do they have special requirements for data?
What would I need to reproduce my analyses in 10 years?
Modularity is a widely used concept for research data management. When applying the concept of modularity, data is stored in different phases of the research process, e.g. source data, raw data, and derivative data. Source data is typically the data as you get them. This can be the output of a software program (e.g. LimeSurvey or Unipark), pen-and-paper questionnaires, etc. Raw data is typically the digital form of the source data. When your data is originally collected via pen-and-paper-questionnaires, somehow the data must be transferred to a digital format. When the data is collected directly via software programs, source data and raw data remain the same. Derivative data is typically the data as you report them in a paper or a poster. This contains descriptive and inferential statistics, tables, and figures. Often, derivative data is stored in a results folder of a research project.
Note
The terms of source, raw, tidy, and derivative data are not absolute. They rather reflect a personal understanding of the authors. It makes sense to talk with your research team what you mean by which term. For other researchers, document what you mean by which term e.g. in a README.
TipTidy data as additional modular data
In Section 7.5, we will introduce another data module, called tidy data. Tidy data reflect the data as you analyze them. Thus, separation between data preprocessing and data analyses is enforced.
Benefits of modular data:
easier understanding of different analysis steps
easier extraction of data for the conduction of own analyses
Burden of modular data:
probably need for a dependency file
higher risk for chaotic project structure
NoteWhat is a file-dependency file?
A dependency file displays how different files are related to each other, e.g. which scripts depend on which other scripts or on which data files. A dependency file can determine whether a file needs to be reexecuted based on changes in its dependent files. This can be useful for humans and machines, if this reexecution should be done automatically.
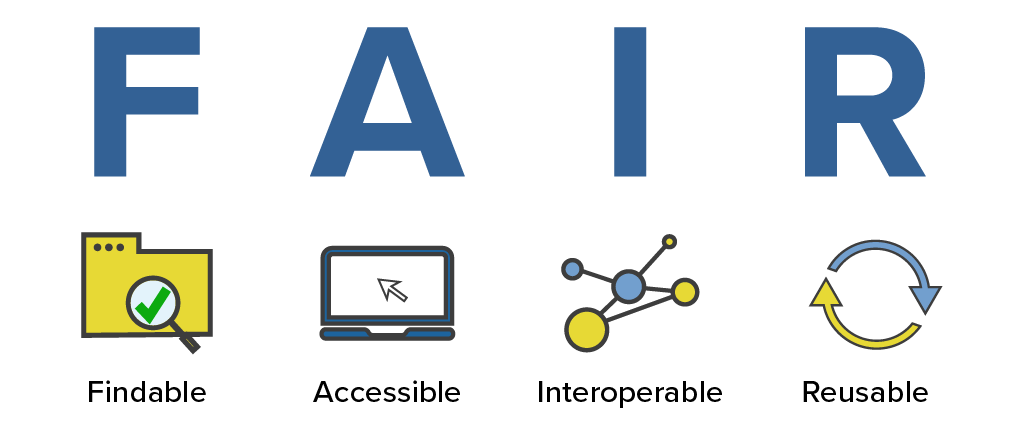
Wilkinson et al. (2016) published the FAIR principles for research data management. FAIR stands for Findable, Accessible, Interoperable, and Reusable. FAIR is a popular concept that has been adopted for various research properties, such as FAIR data and FAIR research software (Wilkinson et al. 2016; Barker et al. 2022).
The FAIR data principles were originally introduced to enhance the machine readability of data. As a side effect, human readability also increased. However, enhancing reproducibility was not a primary goal when implementing FAIR principles.
Thus, we will only address two concepts we believe are relevant for computational reproducibility: persistent identifiers, such as Digital Object Identifiers (DOIs), and metadata. DOIs make your scientific output (e.g., articles, datasets, code) findable, thereby enhancing the possibility of other researchers reproducing your scientific output.
TipWhat is a Digital Object Identifier (DOI)?
A Digital Object Identifier (DOI) is a unique alphanumeric string assigned to a digital document or resource to provide a permanent and stable link to it. DOIs are commonly used to identify and provide a persistent link to scholarly articles, research papers, books, datasets, and other types of digital content. The purpose of a DOI is to ensure that the content can be reliably located and accessed over time, even if the web address (URL) of the resource changes.
Key features of DOIs include:
Uniqueness: Each DOI is unique to a particular resource, ensuring that no two resources have the same identifier.
Persistence: DOIs are designed to remain unchanged, providing a persistent link to the resource even if it is moved or the URL changes.
Interoperability: DOIs are widely used in scholarly publishing and other sectors, making them interoperable across different systems and platforms.
Accessibility: DOIs are often associated with metadata that provides information about the resource, such as author, title, publisher, publication date, and more.
Citations: DOIs are commonly used in academic and scientific citations to provide a standardized and reliable reference to a specific resource.
DOIs are typically assigned and managed by registration agencies, such as CrossRef for scholarly content or DataCite for research data. Organizations and publishers assign DOIs to their digital content to enhance discoverability, citation tracking, and long-term accessibility.
NoteHow to set up a persistent identifier with OSF?
Make your project public — this will generate a DOI.
NoteHow to set up a persistent identifier with Zenodo?
The version control book by Wittkuhn and Pagenstedt (2024) gives a detailed instruction on how to set up a DOI with Zenodo. We therefore ask you to read the respective chapter.
TipWhat is metadata?
A short definition is that metadata is data about your data. More thoroughly, metadata is a set of data that describes and gives information about other data. However, metadata does not contain the data itself.
*Example:
Imagine you write a text message to one of your friends. The data would be your message. Metadata would contain information about the forwarder, the recipient, the time the message was sent, the used device, and so on …
The same applies to your research data. Metadata contains information about your project, variable names and labels, response formats, affiliations, etc. Remember the pandas wondering what all the variables Sam1, …, Sam4 mean? That is what you can describe with metadata.
5.5 Data organization
There are many different ways to organize your data. There is really no right or wrong here, but there are some valuable guidelines aimed at enhancing reproducibility. Data organization is not only about folder structure and precise naming. It is also about choosing file formats that enhance usability for both humans and machines. Further, it includes the use of metadata to describe your data. Due to the variety of organizational styles, you should establish a consistent approach to organizing your data. Thus, you need to apply a standard for your data.
First, you should consider the type of data you are working with. EEG data might have different requirements than MRI data, eye-tracking data, cardiological data, questionnaire data, and so on. How complex is your data, and how should it be arranged?
Second, after determining your data type, you’ll realize that you’ll face specific analysis pipelines. For example, raw EEG data must be handled differently from MRI data, and so on. You might need to use specific analysis software that requires certain file formats or other specific requirements.
Third, check whether there is a standard in your scientific community. Community standards help to organize your data, facilitating cooperation between different labs and ensuring consistency within your own lab. Additionally, if you want to reproduce data, you will have a harder time if the data is organized in a format you are not familiar with. Adopting a widely used data organization style will make reproducibility much easier.
5.5.1.2 Example: Brain Imaging Data Structure (BIDS)
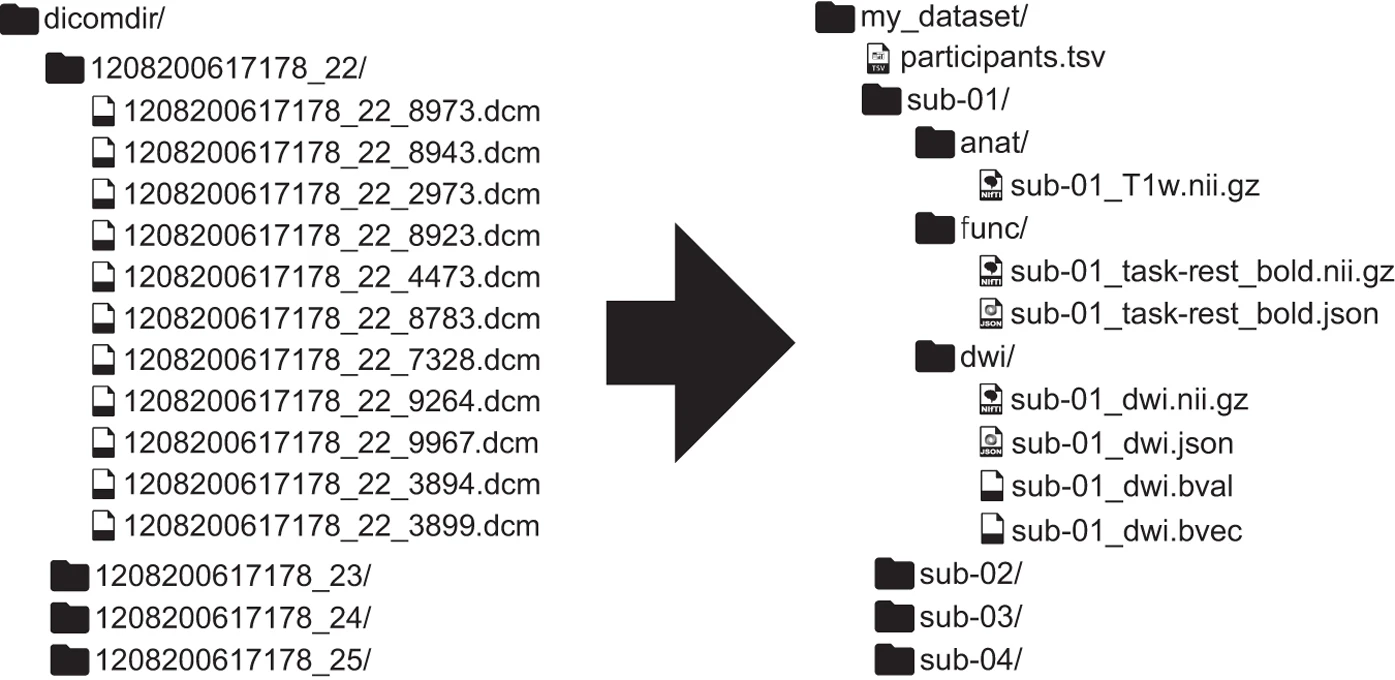
The community standard Brain Imaging Data Structure (BIDS) was introduced by Gorgolewski et al. (2016), providing a data organization standard for the neuroimaging scientific community. MRI research faced the issue of producing many different output files, ranging from plain text to multidimensional image data files. Additionally, different scanners produced different output files, and there was no consensus on how to organize and share these data. This led to misunderstandings, wasted time rearranging data, and potential sources of error.
Reproducing the entire BIDS standard in all its facets would be beyond the scope of this book. Thus, we will focus on high-level concepts that could be analogously applied to a variety of scientific projects.
NoteSteps to create a BIDS compatible dataset
Convert files
Create folder structure, rename, and copy files
Add remaining data
Add missing metadata
Validate the dataset
When your data analysis pipeline requires your data to be in a specific format, make sure to convert your data files into the correct format. Specific software is often used for this purpose in MRI research. In survey-based research, this might not be too complicated. However, when extracting data from your survey servers (such as Unipark or LimeSurvey), ensure you use the correct format.
BIDS includes its own folder structure for research projects. When you have your own research project, ensure it aligns with our recommendations from Chapter 2 and project-structure.
Sometimes, you might need to add more information that was not captured during your data collection process (e.g., details of experimental tasks and additional demographic information of participants).
In BIDS, metadata files are created when converting files from one format to another. However, these metadata files may not be exhaustive. You might want to include task descriptions, task instructions, and so on. Section 5.6 describes which metadata can be used in less complex data management scenarios.
A nice feature of BIDS is the BIDS Validator. It checks if any required or recommended metadata is missing. It also identifies incorrect definitions of missing values, wrong units, missing scans, and inconsistent scanning parameters across subjects. Even though you are unlikely to apply the validator outside of neuroimaging, the concept is quite powerful. We have provided a small section about verifying your code, which tackles the same topic but focuses more on your code than on your data. Click here to go to the section (section not merged yet).
TipBenefits of BIDS
What makes BIDS truly beneficial are BIDS apps. BIDS apps are automatically compatible with BIDS datasets. One example of such an app is fMRIPrep. This app provides researchers working with fMRI data an easy workflow for preprocessing fMRI data (Esteban et al. 2019). fMRIPrep automates several steps without requiring manual intervention from the researcher. Thus, BIDS, combined with its apps, is a powerful tool for saving time and effort as a researcher.
fMRIPrep highlights another benefit of data organization standards: When many people rely on such a standard, new innovations emerge that improve the workflow.
Previously, preprocessing fMRI data was a time-consuming task for PhD students and PostDocs in the field of neuroimaging. With fMRIPrep, this process can be done automatically and without manual intervention. By applying the BIDS standard and fMRIPrep to your data, you will require far fewer resources to understand others’ analysis pipelines using the same standards. However, a data organization standard only works well when a lot of people use it. That is one reason why BIDS is successful: It is widely used in the field of neuroimaging.
5.5.1.3 Example: Psychological Data Structure (Psych-DS)
The Psychological Data Structure (Psych-DS) aims to apply the principles of BIDS to behavioral data. Thus, it is heavily based on BIDS. The core idea is to consistently organize data, facilitating data sharing and enhancing the understanding of the data. There is also a guide to help researchers organize their research projects. Like BIDS, Psych-DS provides a validation tool that checks if the data organization has been done correctly. It also has the CEDAR wizard, a tool which creates a standard .json file. This file contains metadata informationen important to understand the dataset(s) someone is working on within a project.
However, Psych-DS has not been widely adopted by researchers, and its development is not as fast as that of BIDS. Therefore, it does not yet have extension tools like fMRIPrep. Nevertheless, Psych-DS could have more impact if more people began using it. The benefit of Psych-DS is clearly its adaptation to behavioral data structures, which can be applied by a wide range of research communities in psychology.
NoteMinimum requirements of a Psych-DS congruent project
one folder for your study / research project
inside that folder, there must exist a folder called data
inside the data folder, all data must be with .csv extension
if the primary data was not a .csv-file, it must be stored in another subfolder called raw
.csv-files in the data folder must have the suffix _data.csv
deliberate use of - and _ to name data files as in Section 3.4.3.1
next to to the data folder a metadata file must exist, named dataset_description.json (see CEDAR wizard)
TipMetadata requirements
"name" - The name of the dataset
"description"- A description for the dataset, which can be as long or as short as you like
variableMeasured - A list of all the variable names that appear anywhere in the CSV file headers in your dataset
Note that Psych-DS uses the term raw data differently than described in the section about modularity. When someone using Psych-DS wording referring to raw data, it is meant what we described above as source data.
5.5.2 Rectangular Data
If you do not have a community standard specifying the data organization, we highly recommend using the rules of rectangular data as proposed by Broman and Woo (2018).
Do not perform calculations in the raw data files.
Do not use font color or highlighting as data.
Make backups.
Use data validation to avoid errors (see Section 7.6.1).
Save the data in plain text files.
We will not go into detail on rules 2, 3, and 6, because we have either already covered these topics earlier or will address them in a separate section later.
5.5.2.1 Be consistent
It sounds easier than it is. If you organize your data consistently from the start, you will not have to spend additional time later “harmonizing” the data. To do so, use consistent codes for categorical variables (decide between different versions of male, Male, m, M). Use a consistent fixed code for any missing values (we prefer using NA, but avoid -999 or similar). Use consistent variable names (decide between saliva_10wk, Saliva_10wk, sal_week10, etc.). Use consistent subject identifiers (decide between 003, pcp003, person-003, etc.). Use a consistent data layout across multiple files. It would be extra work to combine files with different layouts. Use consistent file names (decide between TSST_VR_2024-11-19.csv, 2024-11-19_TSST_virtual-reality.csv, etc.). Use a consistent format for all dates (see Section 3.7.1.3). Use consistent phrases in notes if you have a separate column for them. Be careful about extra spaces within cells (e.g., the difference between “male” and ” male “).
5.5.2.2 No empty cells
Do fill out every cell. When information is missing, use a common code to indicate that it is missing (preferably NA). Merging cells, as you can in Excel, is not recommended, since it will leave some cells empty. Repeat repeating values. If you leave cells empty, it will be harder to infer the repeating values, particularly after some data wrangling.
5.5.2.3 Put just one thing in a cell
In one piece of a spreadsheet, which is a cell, there should only be one piece of information. Do not include units in your cells. It is better to put units in a data dictionary (see Section 5.6). The same applies to notes. Instead of writing 0 (below threshold), create a new column called note and write 0 in the first column and below threshold in the second.
5.5.2.4 Make it a rectangle
As your data usually resides in a two-dimensional spreadsheet, it is best to layout your data in a two-dimensional format as well. Use columns for variables and rows for subjects or observations. The first row should contain variable names. If some data do not fit into one dataset, create a set of rectangular datasets and save them in separate files. Do not use multiple header rows. You can further apply the concept of tidy data(Wickham 2014) to your rectangular dataset (see Section 7.5).
CautionExample of multiple header rows
A
B
C
D
E
day_1
day_2
ID
sleep
sport
sleep
sport
34
7.5
3
6
0.5
35
8
0
8.5
0.5
36
6
2.5
7.5
3
Note: This table deviates from the rectangle form. It also leaves multiple cells empty
5.5.2.5 No calculations in the raw data files
Primary data should just be data. Only data. There should be no means and standard deviations calculated in that primary data. Use scripts to calculate whatever you want, but do not make changes in the primary dataset.
5.5.2.6 Do not use font color or highlighting as data
If you identify outliers or other information you want to highlight, do not highlight them using visualization. Instead, create a new column called outlier and mark the identified outliers as TRUE and the others as FALSE. Visualization is useful in the short term, but it makes it difficult to extract this information for later analysis.
5.5.2.7 Make Backups
Back up your data regularly in multiple locations. Consider using a version control system like Git (see Version Control Book). When you have finished entering data, write-protect your data file. This ensures that you do not accidentally make changes to your dataset.
Open the folder in Finder where your file is located.
Right-click on your file.
Click on Get Info.
Open the section Sharing & Permissions.
Click on Privilege next to your user account.
Select Read only.
Open the folder in Windows Explorer where your file is located.
Right-click on your file.
Click on Properties.
Select the General tab.
Navigate to the Attributes section.
Check the box for Read-only.
Confirm your choice by clicking the OK button.
TBA
5.5.2.8 Use Data Validation to Avoid Errors
Ensure that your entered data is error-free by applying data validation techniques. You can create validation rules using the R package assertr(Fischetti 2023) and its function verify() (see Section 7.6.1).
5.5.2.9 Save data in plain text files
We recommend saving your data files in .csv format. csv stands for “comma-separated values”. This file format is basic and not visually appealing. However, it requires no special software to open and is easy to handle in code. Thus, it enhances computational reproducibility. In countries where commas are used as decimal separators, tab-delimited text files (.tsv) might be an appropriate alternative to .csv. Note that if you have highlighted cells or applied any special features in an Excel file, these features will be lost when saving the file as .csv or .txt.
5.6 Data dictionaries
In addition to rectangular data, it is also valuable to have a data dictionary describing how your data is structured. The data dictionary is also sometimes referred to as a codebook. Your dictionary enhances the understandability of your entire research project and is therefore crucial for computational reproducibility. According to Broman and Woo (2018), your dictionary should contain:
The exact variable name as in your data file.
A version of the variable name that might be used in data visualizations.
A longer explanation of what the variable means.
The measurement units.
Expected minimum and maximum values.
However, more information can be stored in your dictionary. When analyzing data collected from a survey, a variable in your dataset will likely represent an item from that survey. You can then provide information on:
The item in the survey.
The original wording of the item.
The subscale the item belongs to
The author responsible for that item/subscale.
The response format for the item.
Special considerations regarding the item.
Ideally, your data dictionary should also be stored in a rectangular format. Another option is to use a .json file. This offers more flexibility but also presents a new challenge in organizing the data.
TipLearn more: What is a json file?
json stands for JavaScript Object Notation. Thus, everything you write in that file must adhere to the JSON notation style. It would be beyond the scope of this book to explain how data in a .json file should be formatted. However, you can see a small example below to get a sense of how a .json file looks. If you want to dive deeper into the use of .json files, we recommend this Video that explains JSON more thoroughly.
json Code
[{"name":"agr1","item_wording":"I make people feel at ease.","type":"numeric","scale":"agreeableness","min_value":1,"max_value":5},{"name":"agr2","item_wording":"I love children.","type":"numeric","scale":"agreeableness","min_value":1,"max_value":5}]
NoteBenefits of a json-file
Providing metadata in a json format has some useful advantages:
It is easy for humans and especially machines to read
You can read in the json file into R and use the data information for your data analyses
In comparison to spreadsheets, json files are not limited to two-dimensional in- and outputs
your json-file should now be a list object in R and you can use the values of the file with extracting the information you want with indexing 1.
5.7 References
We would like to express our gratitude to Dr. Maike Kleemeyer and the Research Data Management and Open Science working group at the Max Planck Institute for Human Development, Berlin, as well as the following references, which have been essential in shaping this chapter. We also recommend these references for further reading.
Barker, Michelle, Neil P. Chue Hong, Daniel S. Katz, Anna-Lena Lamprecht, Carlos Martinez-Ortiz, Fotis Psomopoulos, Jennifer Harrow, et al. 2022. “Introducing the FAIR Principles for Research Software.”Scientific Data 9: 622. https://doi.org/10.1038/s41597-022-01710-x.
Esteban, Oscar, Christopher J. Markiewicz, Ross W. Blair, Craig A. Moodie, A. Ilkay Isik, Asier Erramuzpe, James D. Kent, et al. 2019. “fMRIPrep: A Robust Preprocessing Pipeline for Functional MRI.”Nature Methods 16 (January): 111–16. https://doi.org/10.1038/s41592-018-0235-4.
Gorgolewski, Krzysztof J., Tibor Auer, Vince D. Calhoun, R. Cameron Craddock, Samir Das, Eugene P. Duff, Guillaume Flandin, et al. 2016. “The Brain Imaging Data Structure, a Format for Organizing and Describing Outputs of Neuroimaging Experiments.”Scientific Data 3 (1). https://doi.org/10.1038/sdata.2016.44.
Herndon, Thomas, Michael Ash, and Robert Pollin. 2014. “Does High Public Debt Consistently Stifle Economic Growth? A Critique of Reinhart and Rogoff.”Cambridge Journal of Economics 38 (2): 257–79. https://doi.org/10.1093/cje/bet075.
Reinhart, Carmen M., and Kenneth S. Rogoff. 2010. “Growth in a Time of Debt.”American Economic Review 100 (2): 573–78. https://doi.org/10.1257/aer.100.2.573.
The Turing Way Community. 2022. The Turing Way: A Handbook for Reproducible, Ethical and Collaborative Research. Zenodo. https://doi.org/10.5281/zenodo.3233853.
Wilkinson, Mark D., Michel Dumontier, IJsbrand Jan Aalbersberg, Gabrielle Appleton, Myles Axton, Arie Baak, Niklas Blomberg, et al. 2016. “The FAIR Guiding Principles for Scientific Data Management and Stewardship.”Scientific Data 3 (1). https://doi.org/10.1038/sdata.2016.18.
Ziemann, M., Y. Eren, and A. El-Osta. 2016. “Gene Name Erorrs Are Widespread in the Scientific Literature.”Genome Biology 17 (August). https://doi.org/10.1186/s13059-016-1044-7.
Since indexing lists in R or RStudio is not part of this book, you can see how to do that in the online materials of a seminar on OpenScience that uses this book as online resource.↩︎

:no_upscale():format(webp)/cdn.vox-cdn.com/uploads/chorus_asset/file/21700662/excel_gene_names_111.gif)